What Is a Grade Curve Calculator?
A grade curve calculator is a tool that adjusts scores using a specific math model. Teachers use these calculators to make grades fair, especially when an exam is tough. (Not sure what your current average is? Use our Grade Calculator to find your raw score first.)
The tool transforms a "raw score/data" into a "curved grade" using three methods:
- Linear Scale: Adding a flat point value to every score.
- Square Root Curve: Boosting lower scores more than higher ones.
- Statistical Normalization: Fitting scores to a Bell Curve distribution.
How We are Calculating Grade Curve Calculator?
Linear Grade Curve Calculator (Flat Scale and Top Score Adjustment)
The linear grade curve calculator is the most popular method in high schools and undergrad courses. It based on a "flat scale" logic, where a specific number of points is added to every student's raw score/data.
This method uses the "Top Score" approach:
- 1Identify the highest score in the class (e.g., 92%).
- 2Calculate the difference between that score and 100% (e.g., 8 points).
- 3Add that difference (8 points) to every student's grade.
This method maintains the original distribution of the class; the distance between an A student and a B student remains identical, but the entire dataset shifts upward.
Square Root Grade Curve Calculator (The Texas Curve)
The square root grade curve calculator uses a non-linear formula. This helps lower-scoring students much more than it helps higher-scoring students. Often known as the "Texas Curve," this method leads to lower returns for higher grades.
- A student with a 100 remains at 100.
- A student with a 64 jumps to an 80.
- A student with a 36 jumps to a 60.
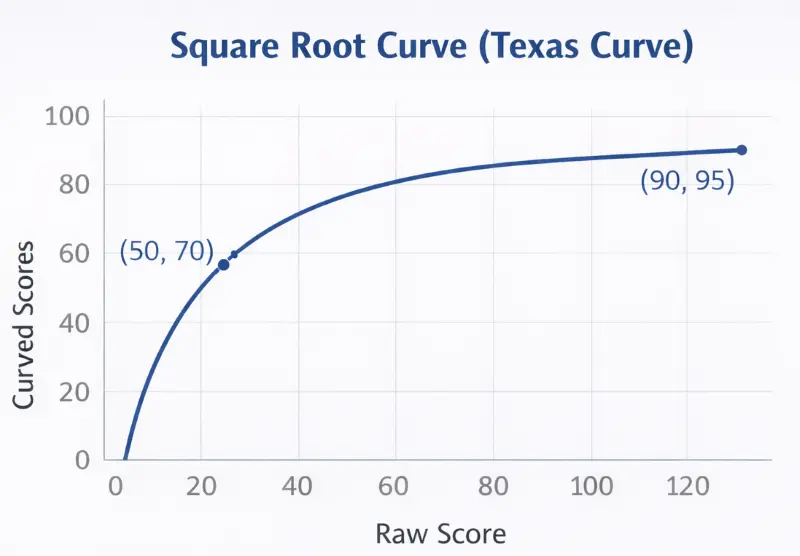
The "Texas Curve" effect: Notice how a raw score of 50 jumps significantly to 70, while a 90 only bumps to 95.
The Square Root Grade method is often used in biology, chemistry, and physics classes where raw scores tend to be low. It allows students who are struggling to improve their grades from a failing (F) to a passing (D or C) without exceeding 100% for those who are doing well. If the curve isn't enough to pass, use the Final Grade Calculator to see exactly what score you need.
Grade Curve Calculator Given Mean and Standard Deviation (Bell Curve)
A grade curve calculator with mean and standard deviation forces scores to fit a "Normal Distribution" or Bell Curve. This method is statistical rather than arithmetic. It requires two key data points:
- The Mean (Average): The central value of the class data.
- The Standard Deviation: How spread out the scores are from the mean.
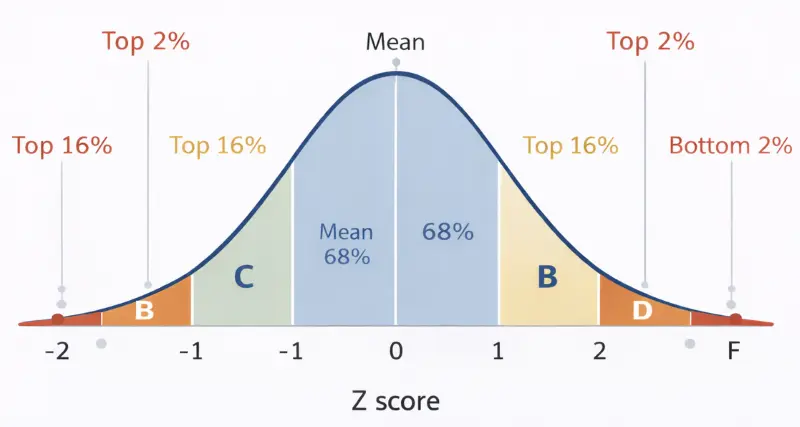
Grading on a Bell Curve: Your grades depend on how far you are from the class average (Z-Score), not just your raw percentage.
In this method, the instructor/teacher sets the grade distribution. E.g., the top 10% students receive A's, and the middle 40% of students get B's. This changes raw scores into Z-scores. This shows where each student stands compared to the class average. This is the main method for a grade bell curve calculator.
Grade Curve Calculator With Median and Class Average
Some teachers prefer a grade curve based on average or median rather than the highest score.
- Mean-Based Adjustment: The teacher sets the class average to a target number (e.g., 75%). If the raw average is 65%, every student receives +10 points.
- Median-Based Adjustment: The teacher uses the median (middle score) to avoid skewing data by outliers (extremely high or low scores).
With this method the "middle" of the class achieves a passing grade, regardless of how difficult the exam was. Tell us, which method you would like to have?
Law School, Cube Root, and Exponential Grade Curve Calculators
- Law School Grade Curve Calculator: Law schools typically adhere to a strict mandatory curve (e.g., the "3.0 to 3.3 curve"). This forces a fixed percentage of students to receive specific grades to prevent grade inflation.
- Cube Root Grade Curve Calculator: Similar to the square root method but more aggressive. It applies the cube root of the raw score multiplied by a factor. This is rare but used in extremely difficult engineering exams.
- Exponential Grade Curve Calculator: Uses an exponential function to adjust grades. This is often used to widen the gap between scores in high-stakes testing.
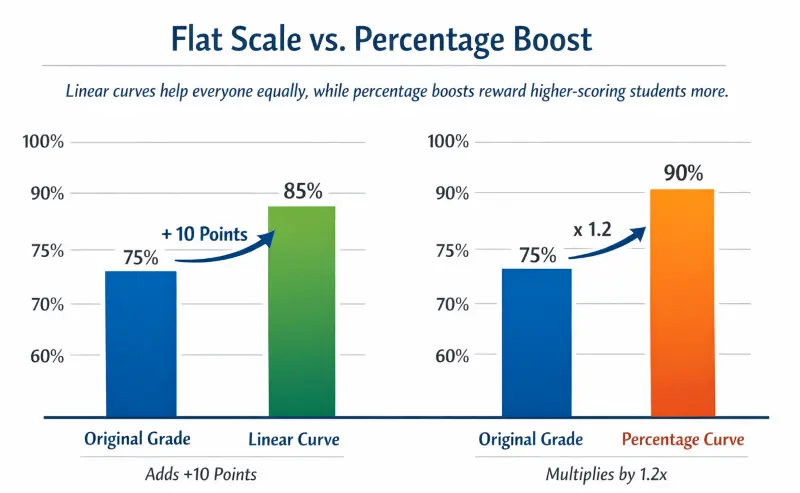
Flat Scale vs. Percentage Boost: Linear curves help everyone equally, while percentage boosts reward higher-scoring students more.
Quick Comparison: Which Curve Method is Best?
| Curve Method | Best Used For... | Student Benefit | Teacher Effort |
|---|---|---|---|
| Linear (Flat Scale) | General exams, History, English | High (Everyone gets points) | Low (Simple math) |
| Square Root | Hard Sciences (Chem/Bio/Physics) | Very High (Helps failing students most) | Medium (Needs calculator) |
| Bell Curve (Normal) | Large University Lectures, Standardized Tests | Mixed (Pits students against each other) | High (Statistical analysis) |
Mathematical Formulas Used for Curving Grades
Formula for Linear Scale (Based on Highest Score)
The formula for a linear grade curve calculator is straightforward arithmetic.
Formula:
- Gradecurved: The final adjusted grade.
- Graderaw: The student's original test score.
- Scorehighest: The highest raw score achieved in the class.
Formula for Square Root Curve Calculation
The formula for the square root grade curve calculator is:
Formula:
This formula mathematically ensures that a raw score of 0 remains 0 and a raw score of 100 remains 100, while all scores in between are lifted along a curve.
Formula for Normal Distribution (Z-Score Calculation)
A grade curve calculator with standard deviation uses the Z-score formula:
Formula:
- Z: The Z-score (standard score).
- X: The student's raw score.
- μ (Mu): The class mean (average).
- σ (Sigma): The class standard deviation.
The Z-score indicates how many standard deviations a score is from the mean. A Z-score of +1.0 usually places a student in the top 16% of the class.
Common Z-Score Percentiles
| Z-Score | Percentile (Class Standing) | Typical Grade |
|---|---|---|
| +2.0 | Top 2% (98th percentile) | A / A+ |
| +1.0 | Top 16% (84th percentile) | B+ / A- |
| 0.0 | Top 50% (Average) | B- / C+ |
| -1.0 | Bottom 16% | C- / D |
| -2.0 | Bottom 2% | F |
How to Create a Grade Curve Calculator in Excel
Setting Up Linear Curves in Spreadsheets
To build a linear grade curve calculator excel sheet:
- 1Column A: Enter Student Names.
- 2Column B: Enter Raw Scores.
- 3Cell D1: Enter the formula =MAX(B:B) to find the highest score.
- 4Column C: Enter the formula =B2 + (100 - $D$1) to apply the curve.
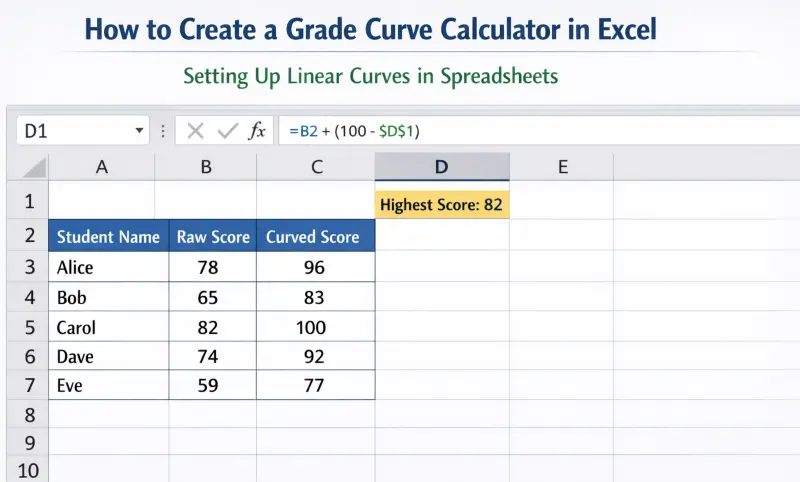
This creates a dynamic "grade curve calculator free" tool that updates automatically as you input grades.
Calculating Mean and Standard Deviation in Excel for Teachers
For a grade curve calculator with mean:
- 1Calculate Mean: Use =AVERAGE(B:B).
- 2Calculate Standard Deviation: Use =STDEV.P(B:B).
- 3Calculate Z-Score: Use =(B2 - Mean) / StDev.
- 4Assign Grades: Use NORM.DIST functions to assign letter grades based on the Z-score percentile.
Hypothetical Grading Scenarios and Data Interpretation
Scenario A: Adjusting a Test Grade Based on the Highest Score
A "test grade curve calculator" often uses the Linear Method.
- Context: A history exam where the highest score was 88%.
- Adjustment: The instructor adds 12 points (100 - 88) to all scores.
| Student | Raw Score | Curve Calculation | Final Grade |
|---|---|---|---|
| Student A | 88% | 88 + 12 | 100% (A+) |
| Student B | 75% | 75 + 12 | 87% (B+) |
| Student C | 60% | 60 + 12 | 72% (C-) |
Scenario B: Assigning Letter Grades Based on a Normal Distribution Curve
A "class grade curve calculator" using the Bell Curve forces a specific distribution.
- Context: Class Mean is 70. Standard Deviation is 10.
- Rule: Top 16% (Z-Score > 1) get A's.
| Student | Raw Score | Z-Score Calculation | Result | Grade |
|---|---|---|---|---|
| Student X | 90 | (90-70)/10 = +2.0 | Top 2% | A |
| Student Y | 80 | (80-70)/10 = +1.0 | Top 16% | A- |
| Student Z | 70 | (70-70)/10 = 0 | Average | B/C |
Frequently Asked Questions About Grading Curves
How Do I Calculate My Grade With a Curve?
You calculate your curved grade by applying the specific formula used by your instructor. If they use a "Linear Scale," add the difference between 100 and the highest class score to your raw grade. If they use a "Square Root Curve," take the square root of your raw score and multiply by 10.
What Is a 65 or 75 Curved Grade?
On a Square Root Curve:
- A 65 curved grade becomes 80.6% (10 × √65).
- A 75 curved grade becomes 86.6% (10 × √75).
On a Linear Curve, the value depends entirely on the gap between the highest score and 100.
Does a Curve Hurt Your Grade or Cause You to Fail?
Yes, a curve can hurt your grade if the class uses a Bell Curve (Normal Distribution) and you score below the mean. In a forced distribution, a specific percentage of students must receive C's, D's, or F's, even if their raw scores were decent. Conversely, linear and square root curves generally only help students; they almost never lower a grade.
Do Teachers Curve Final Grades?
Many professors curve final grades, especially in STEM courses (Science, Technology, Engineering, Math) where raw averages are often low (e.g., 50-60%). However, this is at the instructor's discretion and is usually outlined in the syllabus.
Is Grading on a Curve Fair and Ethical?
Ethics vary by method.
- Linear/Square Root: Generally considered fair as they correct for overly difficult exams without penalizing high performers.
- Forced Bell Curves: Often criticized as unethical because they pit students against each other, ensuring some fail regardless of mastery.
Is Curving Grades Legal in Colleges and Schools?
Yes, there are no federal laws about curving grades, though individual departments or school districts may ban specific types of curves (like forced failure rates).
What Is the Difference Between Curving and Rounding (e.g., 89.5 to 90)?
- Curving: Adjusting the entire class dataset based on a formula (e.g., adding 5 points to everyone).
- Rounding: Adjusting a single student's marginal score to the next integer (e.g., treating an 89.5 as a 90).
Most professors will round an 89.5 to an A, but an 89.4 often remains a B+.
What Does a 20% or 30% Curve Mean?
A "20% curve" usually implies a Percentage Step calculation where the raw score is multiplied by 1.20 (a 20% boost).
- Raw Score: 60
- Calculation: 60 × 1.20 = 72
- Result: The grade increases by 12 points.
Is a 70% a 2.0 GPA or a C Grade?
In standard grading scales:
- 70% typically equates to a C- or C.
- 2.0 GPA equates to a C.
Some strict scales consider anything below 70% as a D, while lenient scales consider 70% a C+.
Do D's Get Degrees and What Is a Failing GPA?
The phrase "D's get degrees" is a generalization.
- General Ed: A "D" often counts for credit.
- Major Requirements: Most universities require a "C" or better for classes in your major.
- Failing GPA: A GPA below 2.0 (C average) usually results in academic probation or suspension.
How Bad Will an F Bring Down Your GPA?
An "F" (0.0 GPA points) significantly lowers your average because it contributes 0 quality points while adding to your total credit hours.
- Example: A student with three A's (4.0) and one F (0.0) drops to a 3.0 GPA. The single F negated the impact of one full A. (For your transcript, calculate your exact score with College GPA Calculator).
Let's Talk About Limitations
While our try to cover standard academic mathematical models. However, each educational institution and individual professor has the authority to use their own grading policies. The formulas provided here (Linear, Square Root, Bell) are standards, but students must consult their specific course syllabus to confirm exactly how their "final grade curve calculator" will be applied.