How to Use EZ Grade Calculator?
You only have to follow two steps:
- 1Set Total Questions: Enter the total number of questions, by default 10 but you can add unlimited question numbers.
- 2Wrong & Correct Answers: Choose "Wrong Answers" (default) or "Correct Answers". Using this, will give you the same and correct results.
- 3Result: Fraction will show the correct answers. You will also see the percentage. Based on the result, it will show you the letter grade.
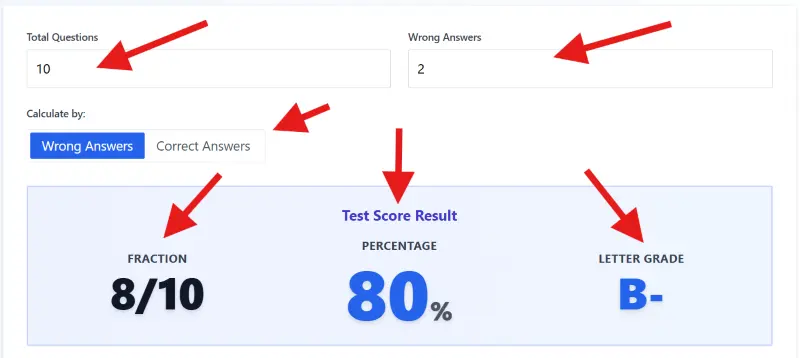
To get your grade, you simply enter the Total Questions and how many you missed.
What is EZ Grade Calculator?
EZ Grade Calculator is a modern look of an old classroom chart/method. Teachers relied on a physical Cardboard Slidechart to grade.
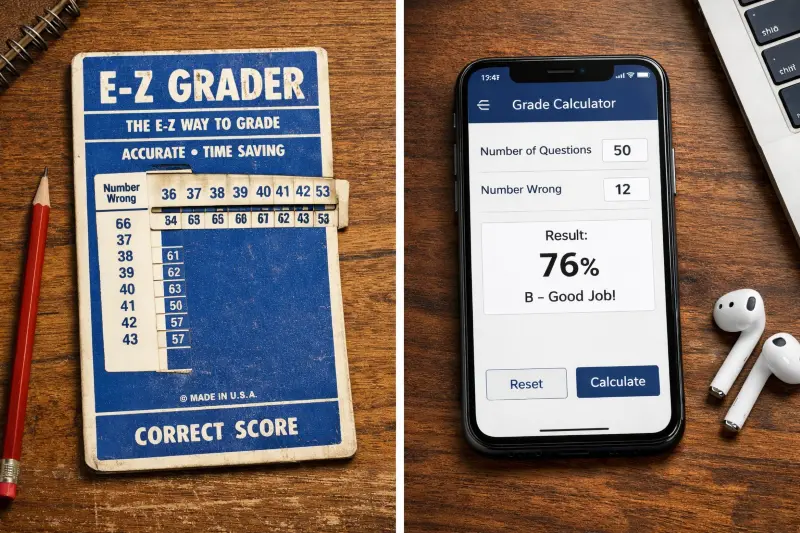
The EZ Grade Calculator is the modern, digital version of the classic cardboard slide charts teachers used for decades.
The Easy Grade Calculator is used for the same work but online.
It allows you to generate a percentage score and letter grade for any test size. Instead of doing manually for every single paper, you simply input the Total Questions and the count of wrong answers.
How Online EZ Grader work?
Unlike the semester grade calculator, it automates the specific math required for "negative grading." Most teachers do not add up correct answers; they count the mistakes.
This tool takes your Number Wrong, subtracts it from the total, and converts the result into a weighted percentage instantly.
Veteran teachers typically memorize grading intervals for standard test sizes like 20 or 50, but universally default to calculation tools for irregular counts like 17 or 23.
How to Calculate Your Grade
The math behind your grade is actually quite simple. However, the method you choose depends on how you prefer to grade.
Most calculators offer two distinct modes: Wrong Answers and Correct Answers. While both produce the exact same percentage, the workflow is different.
Here is exactly how the logic works:
| Method | Formula | Best For |
|---|---|---|
| Wrong Answers | ((Total - Wrong) ÷ Total) × 100 | Speed (Grading large tests) |
| Correct Answers | (Correct ÷ Total) × 100 | Clarity (Short quizzes) |
The "Wrong Answers" Method (Recommended)
This is the standard for most teachers. If you have a 50-question final exam, you do not want to count 43 correct checks. It is much faster to count the 7 mistakes.
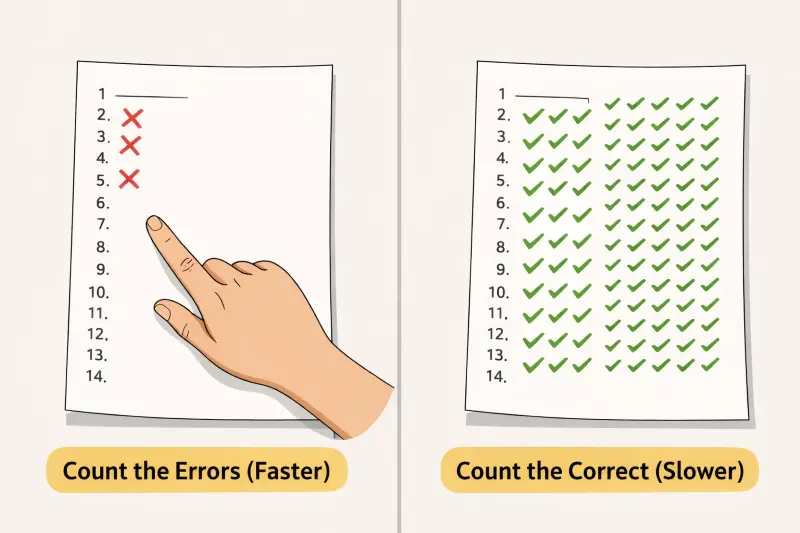
For large tests, use the "Wrong Answers" method. Counting 3 mistakes is much faster than counting 47 correct answers.
You simply enter the Total Questions (e.g., 50) and the Number Wrong (e.g., 7). The calculator subtracts the errors to find the raw score and converts it to a percentage instantly.
The "Correct Answers" Method
This is ideal for students or smaller assignments. If you get a paper back with a score of "43/50," you already know the Number Correct. You enter that directly to verify the percentage and see the corresponding Letter Grade.
Experienced educators almost exclusively favor the "Wrong Answers" method because counting mistakes on a 50-question test is significantly faster than tallying correct responses.
Using the Grading Chart
Once you input your numbers, you do not just get one result. You generate a full Reference Chart. This table highlights your specific score in yellow but also displays every possible outcome for that test size.
- 100% - 97%: A+
- 96% - 93%: A
- 92% - 90%: A-
Click on Print Chart to generate a clean, paper-ready version to keep on your desk for the rest of the grading session.
The Grading Scale (Letter Grades)
A raw percentage is only half the story. You need to know how that number translates into a Letter Grade. While every district differs, this calculator uses the precise Plus/Minus System.
This adds nuance to your score. A 92% is not just an "A." It is an A-, which can affect your GPA differently. Here is the exact breakdown of the grading threshold:
| Letter Grade | Percentage Range | Performance Level |
|---|---|---|
| A+ | 97% – 100% | Outstanding |
| A | 93% – 96% | Excellent |
| A- | 90% – 92% | Approaching Excellence |
| B+ | 87% – 89% | Above Average |
| B | 83% – 86% | Good |
| B- | 80% – 82% | Satisfactory |
| C+ | 77% – 79% | Average |
| C | 73% – 76% | Minimum Passing (Prereq) |
| C- | 70% – 72% | Passing |
| D+ | 67% – 69% | Below Average |
| D | 63% – 66% | Poor |
| D- | 60% – 62% | Minimum Passing |
| F | 0% – 59% | Failing |
Visual Color Coding
To make grading faster, the chart uses Color Cues. You do not need to read every row.
Just look for the color block:
- Green: All A Grades (90%+)
- Blue: All B Grades (80%+)
- Yellow: All C Grades (70%+)
- Orange: All D Grades (60%+)
- Red: Failure (< 60%)
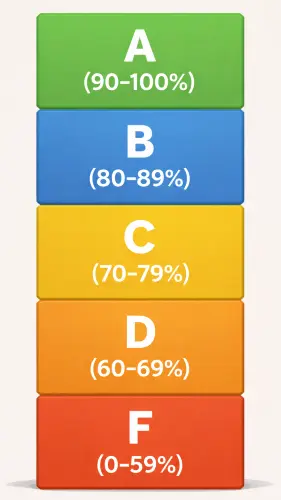
Our chart uses color cues so you can instantly see where a student stands without reading every single number.
Students frequently contest the "Minus" grades (specifically the 89% B+ and 92% A-) more than any other bracket because the GPA drop-off is often steeper than they anticipate.
Weighted & Unweighted Grading
Are all assignments created equal? Usually, the answer is No.
Unweighted Grading treats every point the same. This is exactly what the EZ Grade Calculator does. It assumes Question #1 is worth the same as Question #10. This is standard for checking a single test or quiz.
But Weighted Grading is different. It places higher value on specific categories. For example, a Final Exam might be worth 30% of your total course grade, while a homework assignment is only worth 10%.
To understand the difference, look at this breakdown:
| Feature | Unweighted Grading | Weighted Grading |
|---|---|---|
| Logic | Total Points / Total Possible | (Grade × Category Weight) |
| Impact | Every item counts equally | Major exams dominate the score |
| Example | Pop Quizzes, Standard Tests | Semester Final Grades, GPA |
| Tool Needed | EZ Grade Calculator | Weighted Grade Calculator |
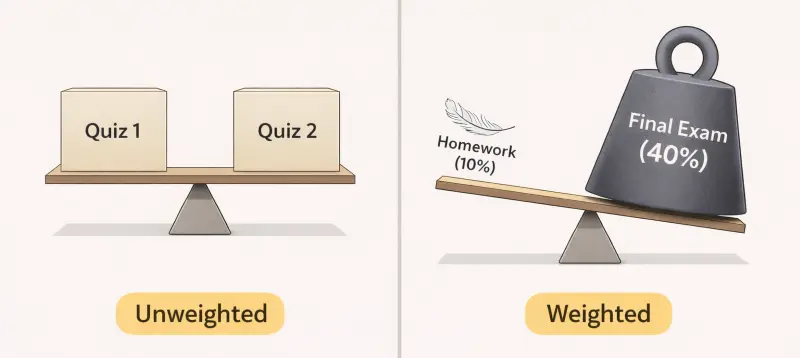
In Unweighted grading (left), every assignment is equal. In Weighted grading (right), exams have a much bigger impact on your score.
If you use a simple average on a weighted course, your math will be wrong. You might think you have a B+ because you did well on homework. But if you failed the weighted Midterm, your actual grade could be a C.
Syllabus "fine print" regarding weighted categories is frequently overlooked by students until the final week of the semester, often resulting in panic over mathematically impossible recovery scenarios.
Partial Credit & Half Points
Real life rarely happens in whole numbers. Teachers often give Partial Credit for showing work, resulting in scores like "minus 1.5."
Most physical slidecharts cannot handle decimals. They force you to round up or down, which makes the grade inaccurate.
The EZ Grade Calculator solves this by accepting decimals directly. If a student gets "half points" off, you can enter 1.5 or 0.5 into the "Wrong Answers" field.
Here is how the math changes:
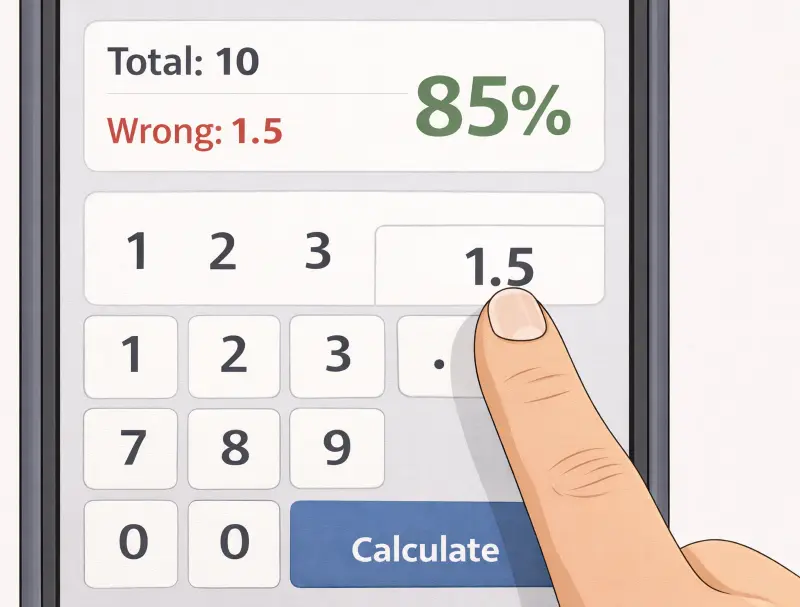
Unlike physical slide charts, the digital calculator handles half-points and decimals for accurate partial credit.
| Number Wrong | Math Calculation | Final Score |
|---|---|---|
| 1.0 (Standard) | (20 - 1) ÷ 20 | 95.0% |
| 1.5 (Partial) | (20 - 1.5) ÷ 20 | 92.5% |
| 2.0 (Standard) | (20 - 2) ÷ 20 | 90.0% |
That small "0.5" difference often changes the Letter Grade. In the example above, a 92.5% is a solid A, while a 90% drops to an A-. Using exact decimals ensures the student gets every point they earned.
Engineering and Math departments are historically more likely to award partial credit than Humanities departments, which tend to grade holistically based on overall impression in the final exam.
Grade Chart and Common Scores
Sometimes you do not need a calculator. You just need the score for a specific fraction.
Teachers often grade the same "irregular" test sizes over and over. Instead of typing them in every time, use this Cheat Sheet.
Here are the most searched Test Scores for quick reference:
| Fraction (Score) | Percentage | Letter Grade |
|---|---|---|
| 7 / 10 | 70% | C- |
| 8 / 10 | 80% | B- |
| 11 / 15 | 73% | C |
| 12 / 15 | 80% | B- |
| 18 / 25 | 72% | C- |
| 23 / 30 | 76% | C |
| 35 / 40 | 87.5% | B+ |
| 45 / 50 | 90% | A- |
Why these numbers?
Notice that missing just a few points on small tests (like 15 questions) drops the grade fast.
A score of 11/15 feels like "mostly correct," but it is barely passing (73%). A score of 7/10 is the psychological "tipping point" where students typically accept the grade and move on, whereas 6/10 almost universally triggers a request for a retake or extra credit.
Calculation Mistakes & Rules
1. The "Zero"
A missing assignment is not just a low grade. In many digital gradebooks, it counts as a Zero.
Mathematically, a zero destroys a GPA faster than an F.
If you have a 100% and get a 50% (F) on the next test, your average is 75% (Passing). If you have a 100% and take a Zero, your average drops to 50% (Failing).
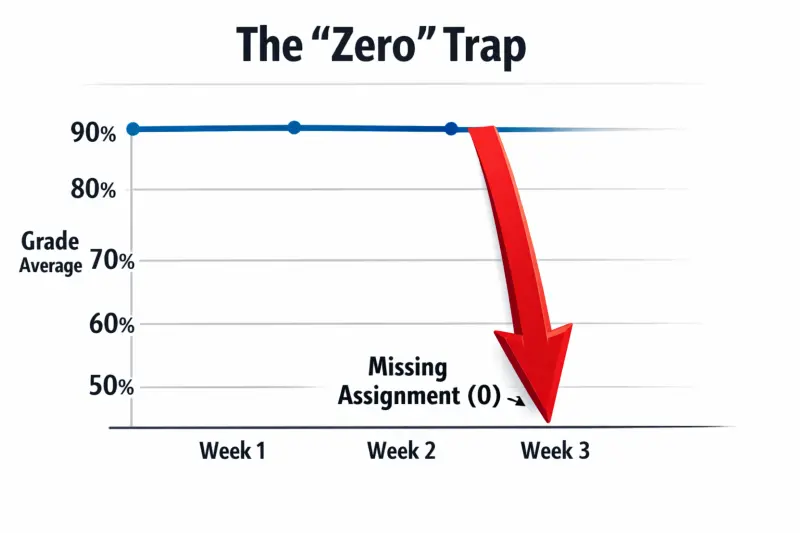
A "Zero" is mathematically devastating. It pulls your average down much faster than a failing test grade.
2. The "Point Value"
Do not assume every question is worth One Point. This is the most common error on mixed tests. A multiple-choice question might be worth 1 point, while an essay question is worth 10.
If you use a standard EZ Grader based on "Number of Questions" for this, your score will be wrong.
You must calculate based on Total Points Possible, not the question count.
3. The Curve
Your raw score might be 65%. But that does not always mean you failed. If the class average was extremely low (e.g., 40%), the professor might apply a Bell Curve or a "Simple Bump."
Always check if your grade is "Raw" or "Curved" before panicking.
A 65% on a difficult Chemistry final could easily scale to a B. Teachers rarely apply curves to individual quizzes; they are almost exclusively reserved for Midterms and Finals where the data set is large enough to justify statistical adjustment.
Frequently Asked Questions
What is the formula for calculating a EZ grade?
You divide the number of correct answers by the total number of questions. Then, multiply that result by 100 to get the percentage. For example: 40 ÷ 50 = 0.8, which is 80%.
Does one wrong answer affect my grade more on a short test?
Yes. On a 5-question quiz, one mistake drops you to an 80%. On a 100-question test, one mistake only drops you to 99%. The fewer questions there are, the more "valuable" each point becomes.
How do I calculate my grade if questions have different point values?
You cannot simply count the number of questions. You must sum the Total Points Earned and divide by the Total Points Possible. If an essay is worth 10 points and a multiple-choice question is worth 1 point, treat the essay as "10 questions" in the calculator.
What is a passing grade in most colleges?
A D (60-69%) is considered passing for graduation. However, many "prerequisite" courses (classes you need to take before the next level) require a C (70% or higher) to advance.
Can I use this calculator for weighted grades?
No. The EZ Grade Calculator is designed for single assignments (Unweighted). Easy grader does not account for category weights like "Exams = 40%" and "Homework = 20%."
How do I handle bonus points?
Add the bonus points to your "Number Correct" (numerator) but keep the "Total Questions" (denominator) the same. This can result in a score over 100% (e.g., 55/50 = 110%).
Is a 3.0 GPA good?
A 3.0 represents a "B" average. It is generally considered a solid, respectable baseline for most college admissions and employment opportunities, use the GPA Calculator for your college GPA.
What is the difference between a physical E-Z Grader and this?
A physical cardboard slider is limited to whole numbers and specific test sizes (usually up to 100). This digital tool handles decimals (like 12.5 wrong) and any number of questions (even 150+).
Can I print the grading chart?
Yes. Once you generate your score, click the "Print Chart" button. It formats the table specifically for standard paper so you can keep a physical reference copy on your desk.
The most frequent student email regarding grades is almost always a request to clarify why a specific percentage (e.g., 89.6%) did not automatically round up to the next letter grade.